Prometheus Node Exporter

1️⃣ What is Node Exporter?
Node Exporter is a Prometheus exporter that exposes OS-level system metrics from a Linux server.
It collects:
-
CPU usage
-
Memory usage
-
Disk usage & I/O
-
Network traffic
-
Load average
-
Filesystem stats
-
Hardware info
👉 It does NOT monitor applications
👉 It monitors the server itself
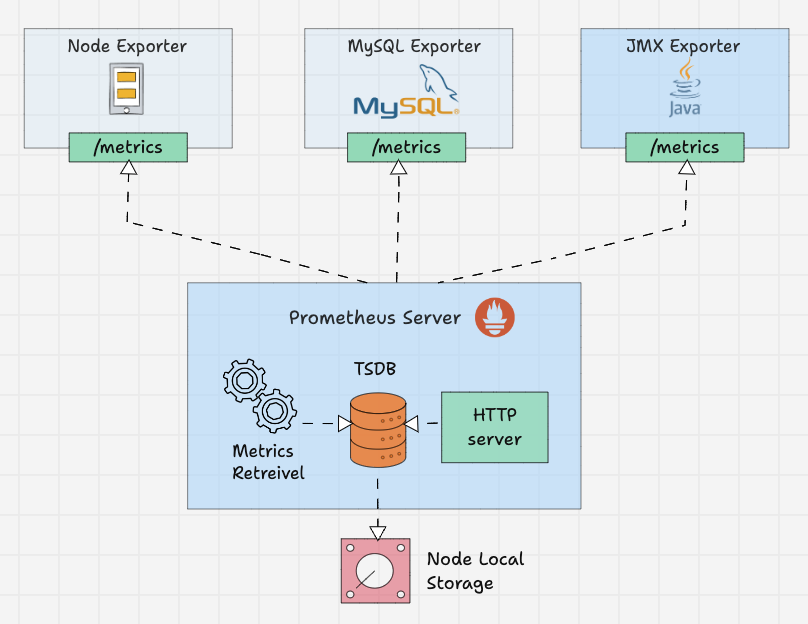
2️⃣ Where Node Exporter Fits
3️⃣ When to Use Node Exporter
✅ Monitor VM / bare metal
✅ Cloud servers (AWS, Azure, DO, OCI)
✅ Kubernetes nodes
❌ Not for application-level metrics
4️⃣ Default Port
Metrics endpoint:
5️⃣ Installation (Linux – Recommended Way)
Step 1: Download Binary
cd /tmp
wget https://github.com/prometheus/node_exporter/releases/latest/download/node_exporter-1.7.0.linux-amd64.tar.gz
Step 2: Extract
Step 3: Move Binary
6️⃣ Create Systemd Service (IMPORTANT)
Create Service File
Paste This
[Unit]
Description=Node Exporter
After=network.target

[Service]
User=nobody
ExecStart=/usr/local/bin/node_exporter

[Install]
WantedBy=multi-user.target
Enable & Start
sudo systemctl daemon-reexec
sudo systemctl daemon-reload
sudo systemctl enable node_exporter
sudo systemctl start node_exporter
Check Status
7️⃣ Verify Node Exporter
Open in browser:
✔ If you see metrics → working correctly
8️⃣ Firewall Rules (IMPORTANT)
Or allow only Prometheus server IP (recommended).
9️⃣ Integrate with Prometheus
prometheus.yml
Reload Prometheus
🔍 10️⃣ Verify in Prometheus UI
Open:
Check:
-
Status → Targets
-
node_exportershould be UP
📈 11️⃣ Grafana Dashboard (Recommended)
Step 1: Add Prometheus as Data Source
Step 2: Import Dashboard
Best Dashboard ID
✔ “Node Exporter Full”
12️⃣ Key Metrics You’ll Use
| Metric | Meaning |
|---|---|
| node_cpu_seconds_total | CPU usage |
| node_memory_MemAvailable_bytes | Free memory |
| node_filesystem_avail_bytes | Disk free |
| node_load1 | Load avg |
| node_network_receive_bytes_total | Network in |
| node_disk_io_time_seconds_total | Disk IO |
13️⃣ Alerts (Example)
High CPU Alert
- alert: HighCPUUsage
  expr: avg(rate(node_cpu_seconds_total{mode!="idle"}[5m])) > 0.8
  for: 2m
  labels:
    severity: warning
  annotations:
    summary: "High CPU usage detected"
14️⃣ Node Exporter in Docker
docker run -d \
  --name=node-exporter \
  -p 9100:9100 \
  --pid=host \
  -v "/:/host:ro,rslave" \
  prom/node-exporter \
  --path.rootfs=/host
15️⃣ Node Exporter in Kubernetes
kubectl apply -f https://raw.githubusercontent.com/prometheus/node_exporter/master/examples/node-exporter-daemonset.yaml
Runs on every node as DaemonSet.
16️⃣ Security Best Practices
✔ Do not expose 9100 publicly
✔ Restrict access to Prometheus IP
✔ Use firewall rules
✔ Run as non-root
✔ Use VPN / private network
17️⃣ Node Exporter vs Alternatives
| Tool | Purpose |
|---|---|
| Node Exporter | OS metrics |
| cAdvisor | Container metrics |
| Telegraf | Metrics + logs |
| CloudWatch Agent | AWS only |
| Azure Monitor Agent | Azure only |
18️⃣ Real-World Production Setup
19️⃣ Common Mistakes ❌
| Mistake | Fix |
|---|---|
| Port blocked | Open 9100 |
| Target DOWN | Check firewall |
| Wrong IP | Use private IP |
| Running as root | Use nobody |
✅ Final Summary
✔ Lightweight
✔ Zero config
✔ Industry standard
✔ Works everywhere
✔ Perfect for infra monitoring