Grafana for Loki

1️⃣ What is Grafana for Loki?
Grafana is the UI layer for Loki.
-
Loki → stores logs
-
Grafana → search, filter, visualize, alert on logs
Think of it as:
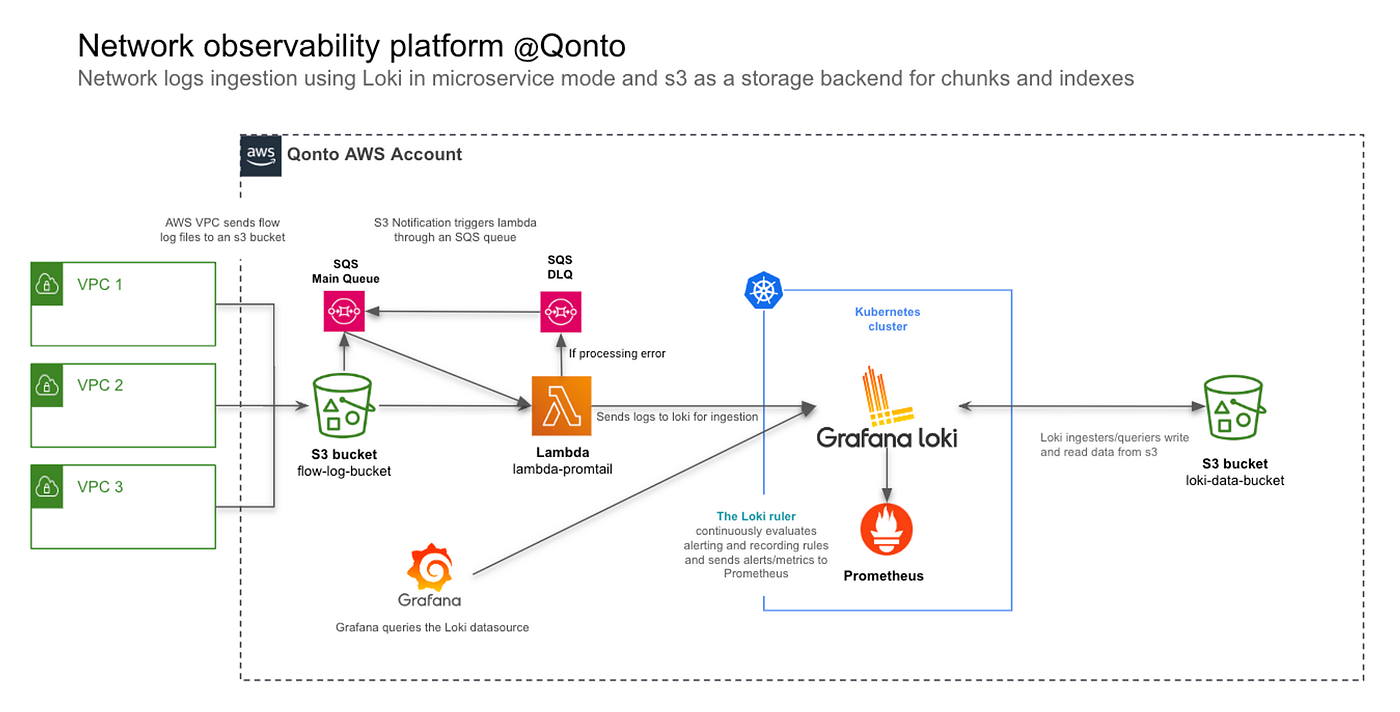
2️⃣ Final Architecture (What You’re Building)
3️⃣ Prerequisites
You already need:
-
Loki running (
http://localhost:3100) -
Promtail pushing logs
-
Grafana running (
http://localhost:3000)
4️⃣ Add Loki as Data Source in Grafana
Step-by-step (UI)
-
Open Grafana
-
Go to:
-
Select:
-
Configure:
-
Click:
✅ You should see “Data source connected”
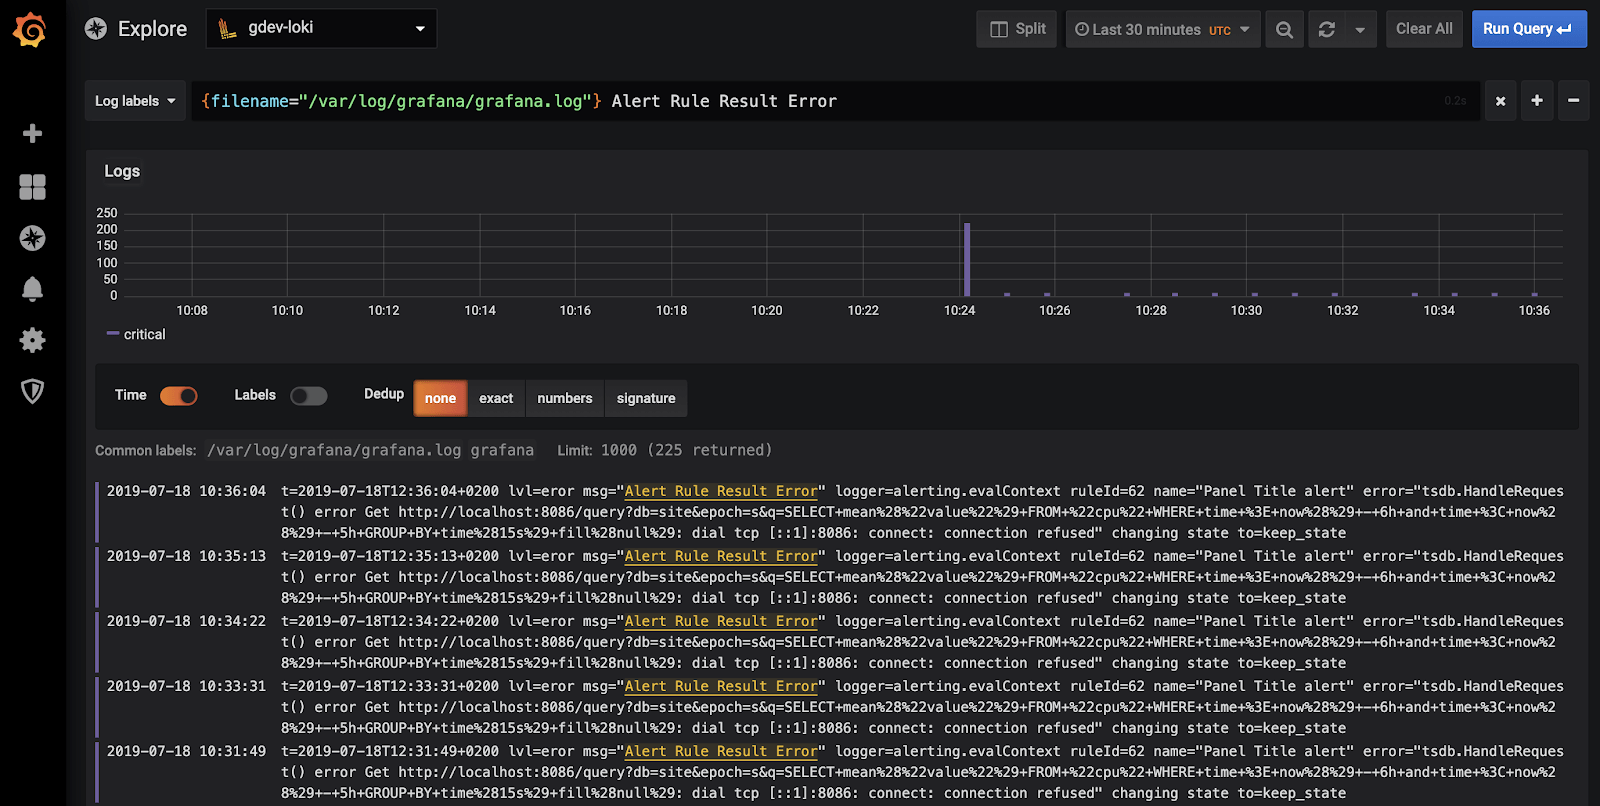
5️⃣ Grafana Explore – Core Log Monitoring Tool
Open Explore
Select data source:
6️⃣ Basic Log Query (VERY IMPORTANT)
Show all pay2chat logs
This is equivalent to:
But now:
✔ searchable
✔ filterable
✔ time-based
✔ persistent
7️⃣ Live Log Streaming (Like -f)
In Explore:
-
Toggle Live
-
Run:
🎯 This behaves like:
8️⃣ LogQL Basics (Must Know)
8.1 Filter by Text
8.2 Exclude Text
8.3 Regex Search
8.4 Time Range
Use Grafana top-right:
9️⃣ If You Parsed Log Levels (Recommended)
If Promtail added:
Query only errors
Query warnings
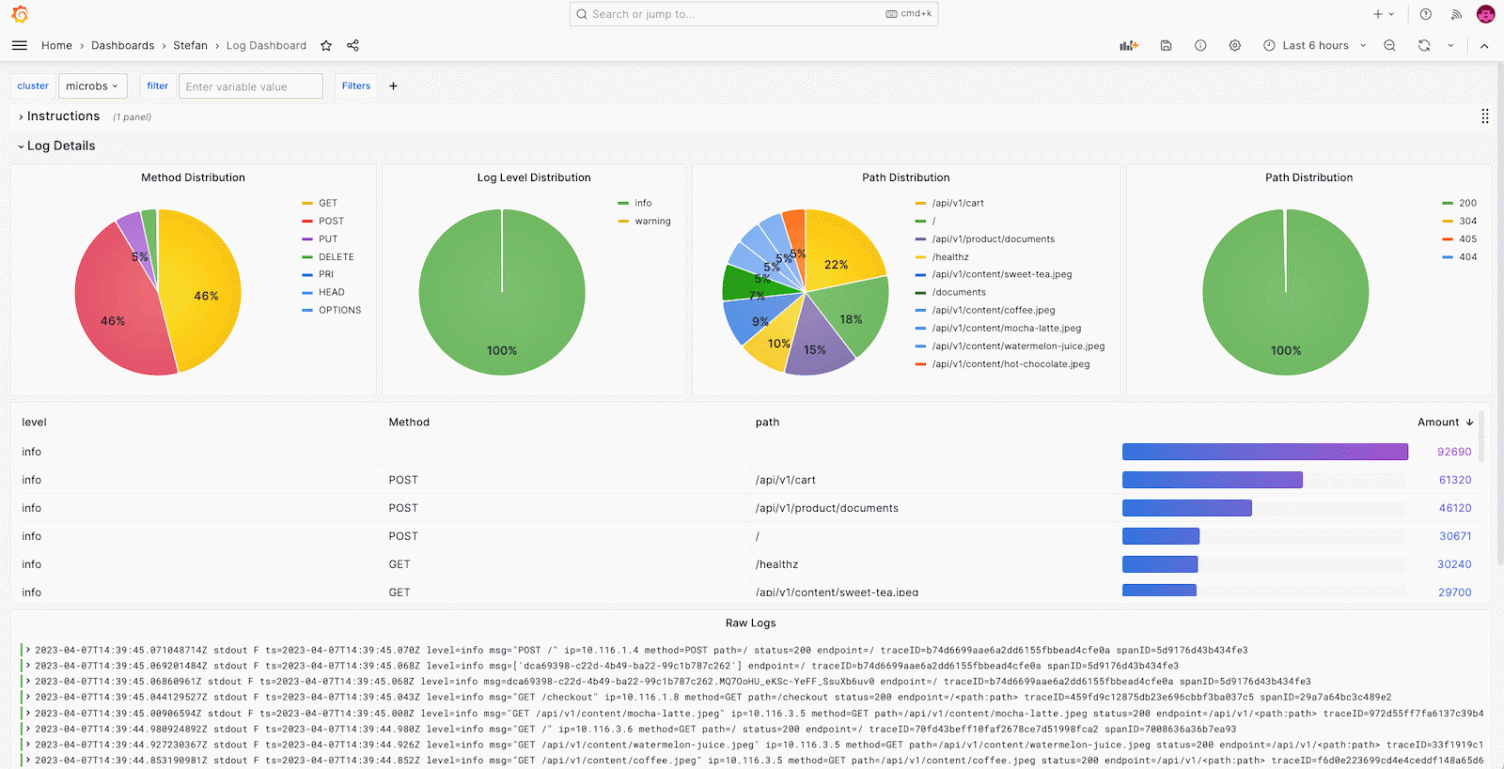
10️⃣ Create Log Dashboards (IMPORTANT)
Logs don’t have to live only in Explore.
Create Dashboard
Add panel:
-
Visualization: Logs
-
Data source: Loki
-
Query:
Save as:
11️⃣ Useful Log Panels to Create
🔹 Errors Panel
🔹 Warnings Panel
🔹 Auth / Login Logs
12️⃣ Convert Logs → Metrics (POWERFUL)
Grafana Loki can count logs.
Errors per minute
Visualization:
- Time series
Now you have error rate graphs 📈
13️⃣ Alerts on Logs (VERY IMPORTANT)
Example: Alert on ERROR logs
Go to:
Query:
Condition:
- For:
2m
Notification:
- Slack / Email / Discord
🚨 You now get alerts when errors appear in logs.
14️⃣ Example: Crash Detection Alert
15️⃣ Correlate Logs + Metrics (Best Practice)
If you already use Prometheus:
Grafana allows:
-
Shared time range
-
Same dashboard
-
Faster debugging
16️⃣ Log Retention Awareness
Grafana does NOT store logs
Loki does.
So:
-
If logs disappear → check Loki retention
-
Grafana only visualizes
17️⃣ Performance & UX Tips
✔ Use labels for filtering, not content
✔ Use text filters sparingly
✔ Narrow time range for faster queries
✔ Avoid wild regex on large ranges
18️⃣ Common Mistakes ❌
| Mistake | Why bad |
|---|---|
| Using user_id as label | High cardinality |
| Searching huge time range | Slow |
| Using Loki for metrics | Wrong tool |
| No alerts | Blind failures |
19️⃣ Recommended Dashboards for pay2chat
Create one dashboard with:
-
Live logs
-
Error logs
-
Error count graph
-
Auth logs
-
Deployment logs
20️⃣ Final Production Observability Stack
✅ Final Summary
✔ Grafana is the control center for Loki logs
✔ Explore = live debugging
✔ Dashboards = observability
✔ Alerts = reliability
✔ Perfect for systemd + backend apps