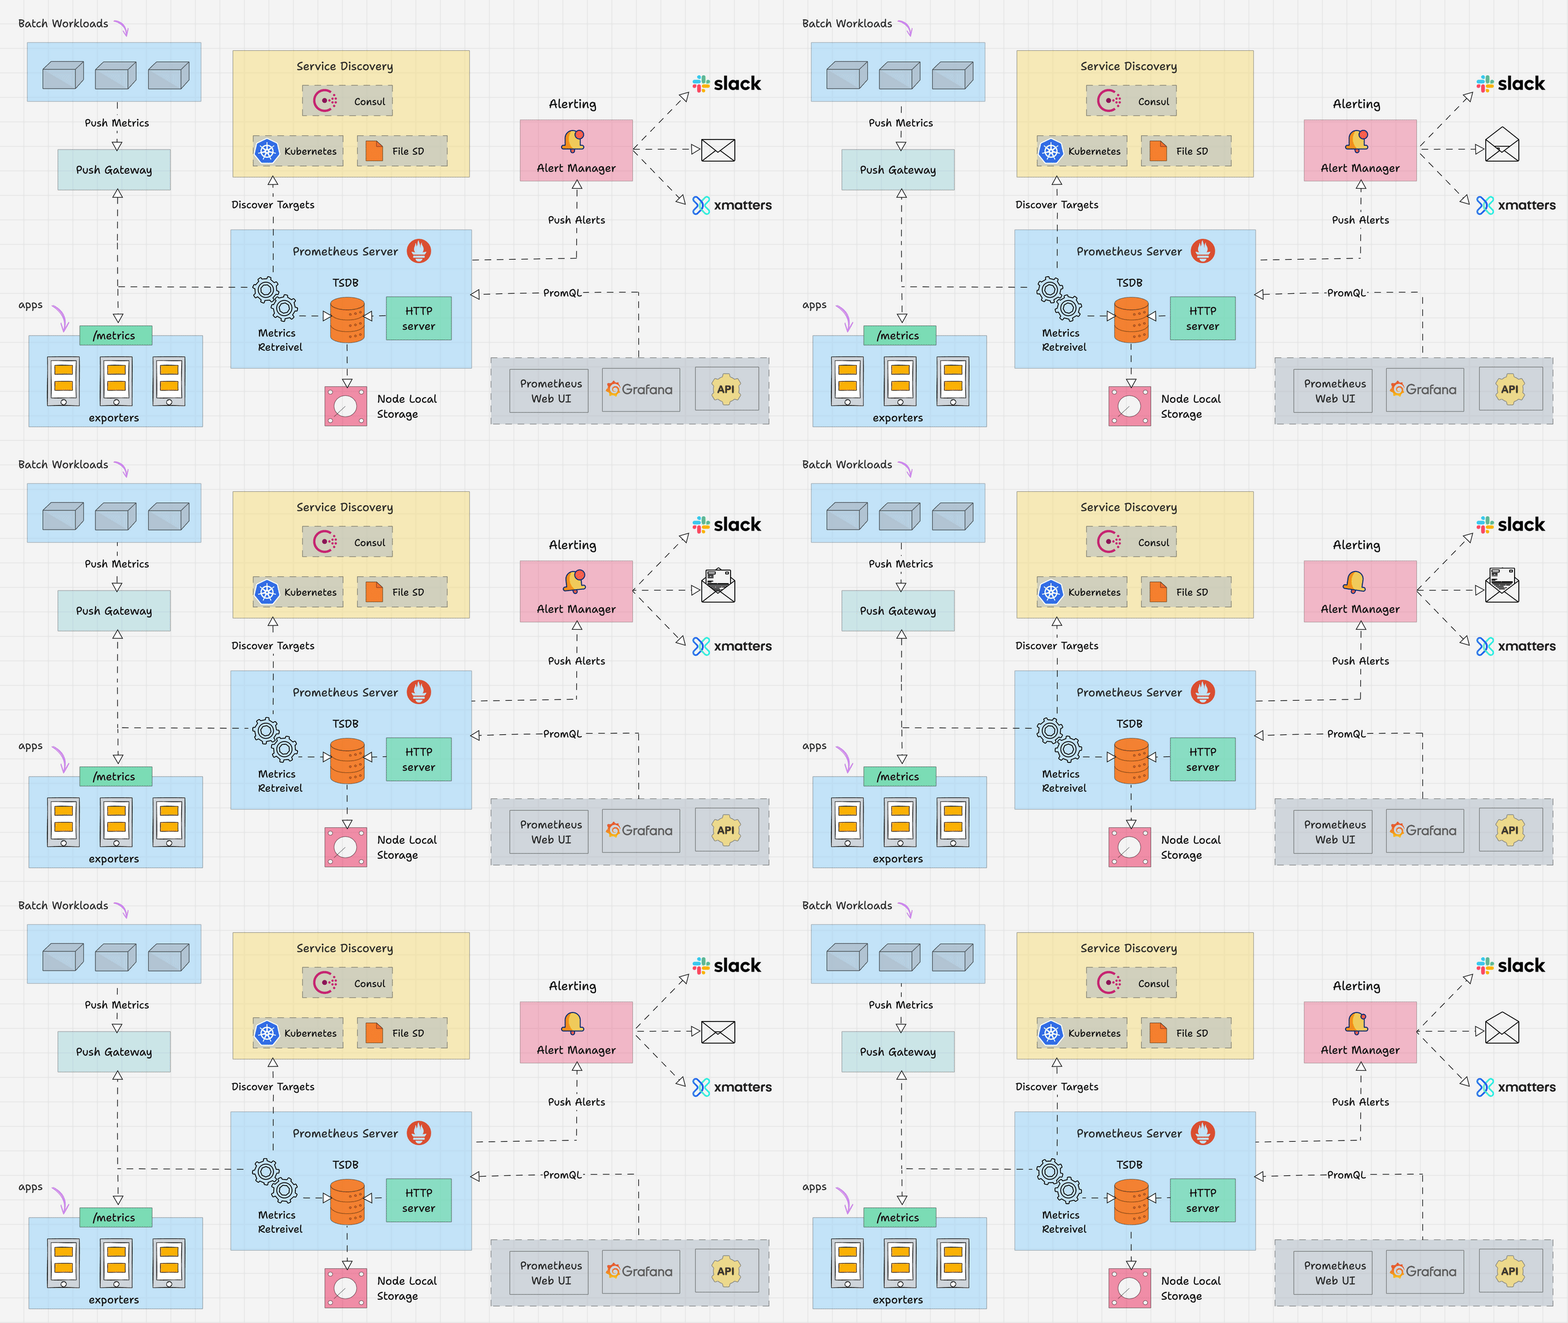
Grafana + Prometheus


1️⃣ What is Grafana + Prometheus?
🔹 Prometheus
-
Collects & stores metrics
-
Uses PromQL
-
Pull-based monitoring
🔹 Grafana
-
Visualizes metrics
-
Dashboards, charts, alerts
-
Works with Prometheus, Loki, etc.
👉 Together = Industry-standard monitoring stack
2️⃣ Architecture Overview
[ Server / App ]
      ↓
[ Exporter (Node Exporter, App Exporter) ]
      ↓
[ Prometheus ]
      ↓
[ Grafana ]
      ↓
[ Alerts → Slack / Email ]
3️⃣ Prerequisites
You need:
-
Linux VM / server
-
Prometheus running (port
9090) -
Node Exporter running (port
9100) -
Internet access
4️⃣ Install Grafana (Linux – Recommended)
Step 1: Add Grafana Repo
sudo apt-get install -y apt-transport-https software-properties-common
wget -q -O - https://packages.grafana.com/gpg.key | sudo apt-key add -
echo "deb https://packages.grafana.com/oss/deb stable main" | sudo tee /etc/apt/sources.list.d/grafana.list
Step 2: Install Grafana
Step 3: Start Grafana
Step 4: Access Grafana
Default login
(Change password after first login)
5️⃣ Add Prometheus as Data Source
Steps in Grafana UI
Configuration
Click Save & Test
✔ Data source connected
6️⃣ Verify Connection (Quick Test)
Go to:
You should see:
7️⃣ Import Ready-Made Dashboards (BEST PRACTICE)
🔥 Most Popular Node Exporter Dashboard
How to Import
8️⃣ Important Dashboards to Use
| Purpose | Dashboard ID |
|---|---|
| Node Exporter Full | 1860 |
| Linux Server | 13978 |
| Docker Monitoring | 893 |
| Prometheus Stats | 3662 |
9️⃣ Key Metrics You’ll See
CPU
Memory
Disk Usage
10️⃣ Create Your Own Dashboard (Basic)
Steps
Example
-
Data source: Prometheus
-
Query:
- Visualization: Time series
Save dashboard.
🚨 11️⃣ Alerts in Grafana (NEW Alerting)
Grafana supports unified alerting (no need Alertmanager for basic alerts).
Example: High CPU Alert
-
Edit panel
-
Go to Alert → Create alert rule
-
Query:
-
Condition: for 2 minutes
-
Notification: Slack / Email
12️⃣ Slack Alert Setup
Create Slack Webhook
Grafana
Paste webhook URL.
13️⃣ Grafana + Prometheus with Docker Compose
version: "3"

services:
  prometheus:
    image: prom/prometheus
    ports:
      - "9090:9090"
    volumes:
      - ./prometheus.yml:/etc/prometheus/prometheus.yml

  grafana:
    image: grafana/grafana
    ports:
      - "3000:3000"
Run:
14️⃣ Grafana + Prometheus in Kubernetes (Overview)
Production standard:
Includes:
-
Prometheus
-
Grafana
-
Alertmanager
-
Node Exporter
15️⃣ Security Best Practices
✔ Do NOT expose Grafana publicly
✔ Change default admin password
✔ Enable authentication (OAuth)
✔ Restrict Prometheus access
✔ Use VPN / private network
16️⃣ Common Problems & Fixes
| Problem | Fix |
|---|---|
| No data | Prometheus URL wrong |
| Dashboard empty | Wrong job labels |
| High CPU alerts noisy | Increase alert duration |
| Grafana restart resets | Use persistent volume |
17️⃣ Grafana vs Prometheus (Clear Difference)
| Tool | Purpose |
|---|---|
| Prometheus | Collect & store metrics |
| Grafana | Visualize & alert |
| Loki | Logs |
| Tempo | Traces |
18️⃣ Production-Grade Monitoring Stack
(Optional)
✅ Final Summary
✔ Prometheus = metrics engine
✔ Grafana = visualization & alerting
✔ Works with VM, Docker, Kubernetes
✔ Industry standard DevOps stack
✔ Scales from startup → enterprise