Prometheus Tutorial

1️⃣ What is Prometheus?
Prometheus is an open-source monitoring & alerting system designed for:
-
Infrastructure monitoring
-
Service monitoring
-
Cloud & container environments
👉 It works on a pull-based metrics model
2️⃣ What Prometheus Is NOT
❌ Log monitoring (use Loki / ELK)
❌ Tracing (use Jaeger / Tempo)
❌ APM replacement
👉 Prometheus = Metrics only
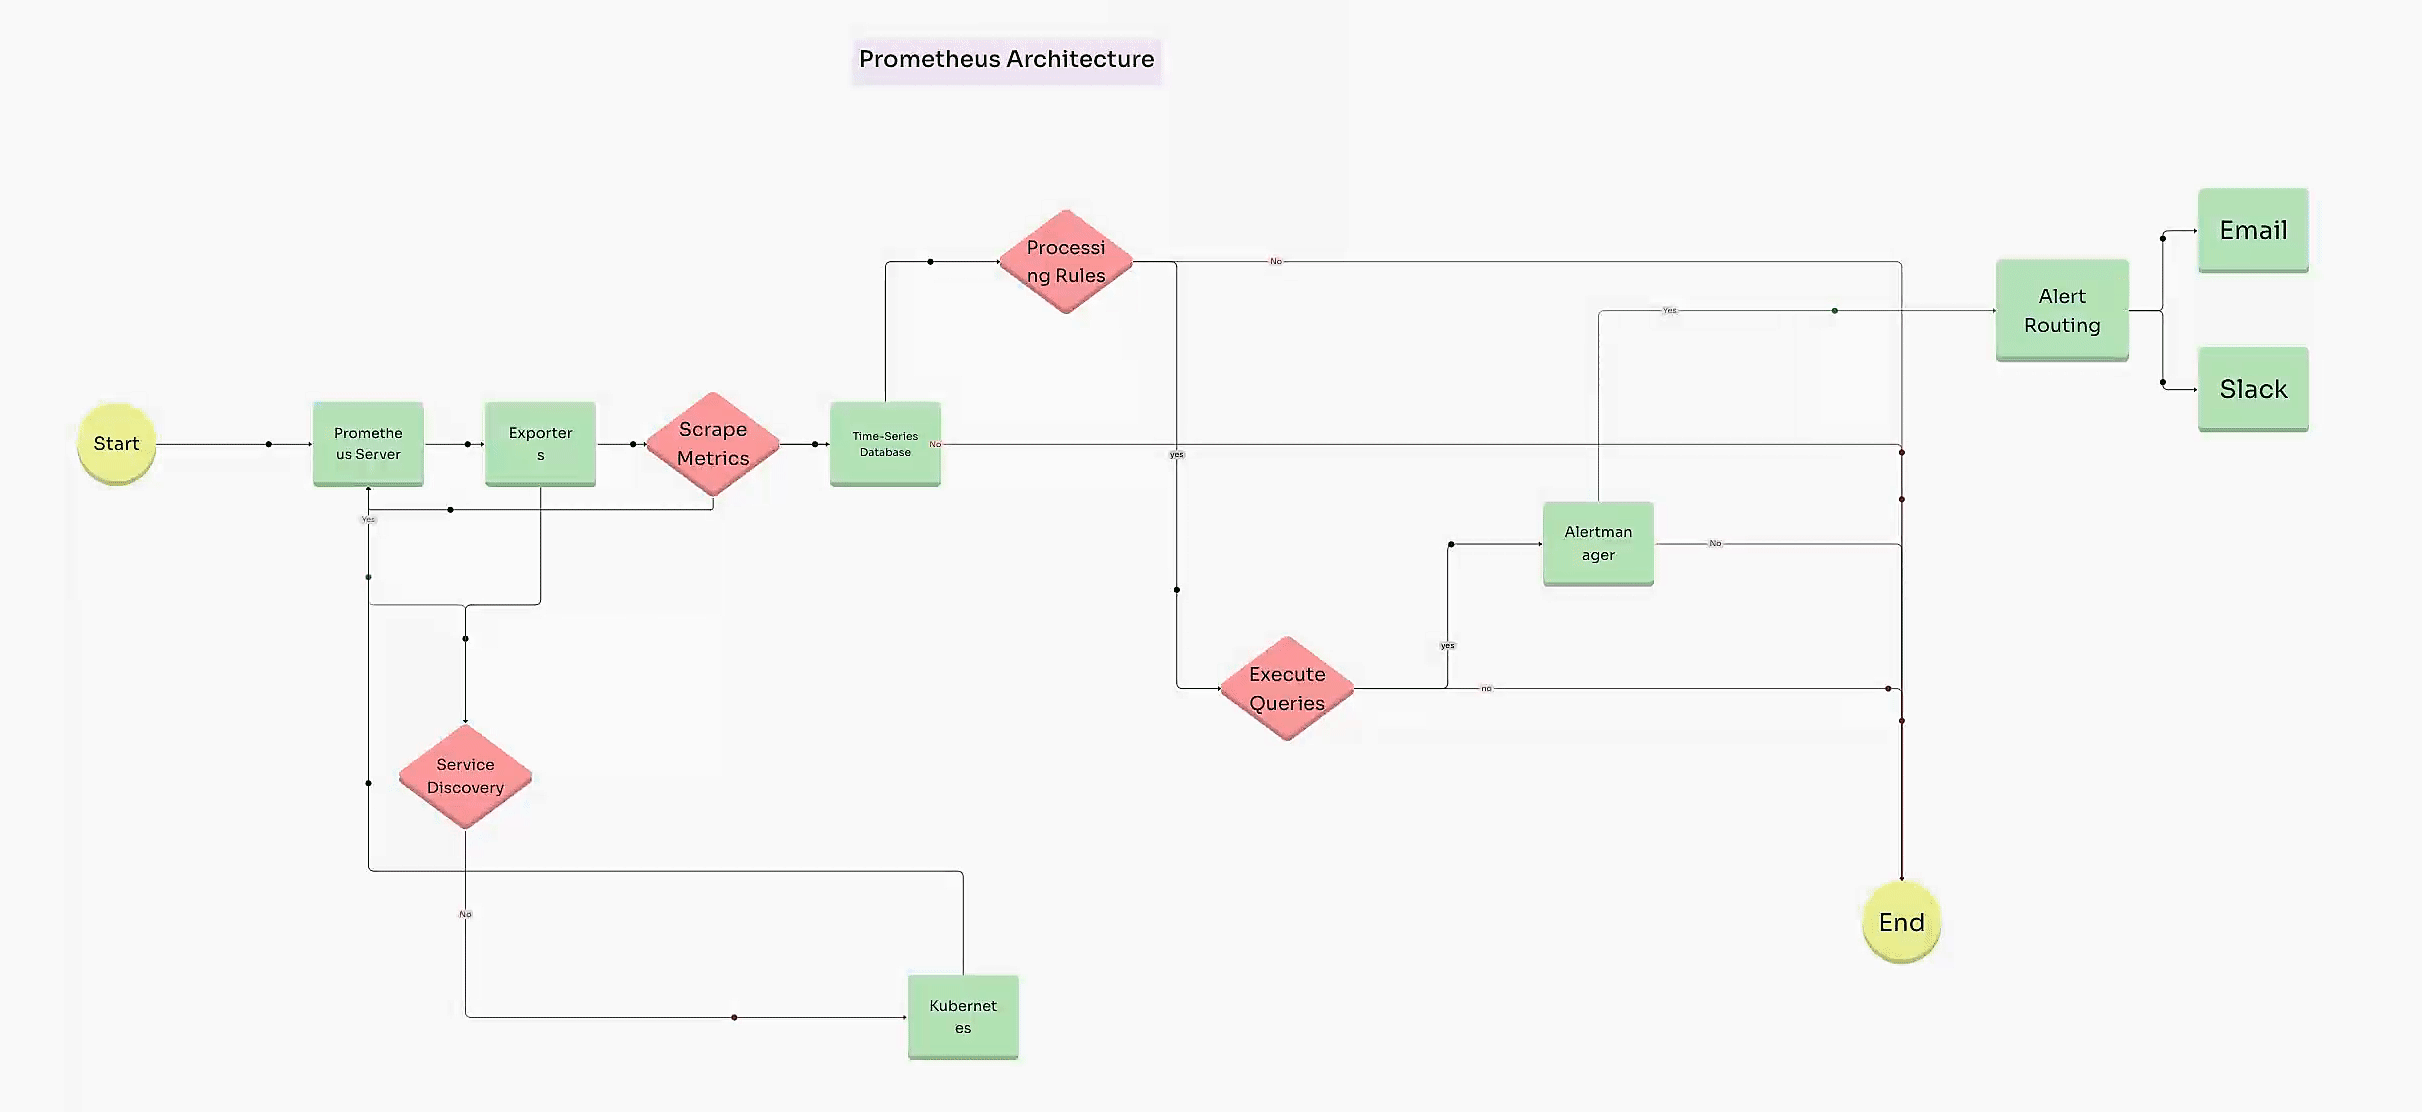
3️⃣ Core Prometheus Architecture
[ App / Server ]
     ↓ (metrics)
[ Exporter ]
     ↓
[ Prometheus ]
     ↓
[ Alertmanager ] → Slack / Email
     ↓
[ Grafana ]
4️⃣ Key Components Explained
🔹 Prometheus Server
-
Scrapes metrics
-
Stores time-series data
-
Evaluates alert rules
🔹 Exporters
Expose metrics in Prometheus format.
| Exporter | Purpose |
|---|---|
| Node Exporter | Server metrics |
| Blackbox | Endpoint uptime |
| cAdvisor | Containers |
| App exporters | App metrics |
🔹 Alertmanager
-
Sends alerts
-
Groups & silences alerts
🔹 Grafana
- Visualization (dashboards)
5️⃣ Installation (Linux VM – Recommended)
Step 1: Create User
Step 2: Download Prometheus
cd /tmp
wget https://github.com/prometheus/prometheus/releases/latest/download/prometheus-2.52.0.linux-amd64.tar.gz
Step 3: Move Files
sudo mv prometheus /usr/local/bin/
sudo mv promtool /usr/local/bin/

sudo mkdir /etc/prometheus
sudo mkdir /var/lib/prometheus

sudo mv prometheus.yml /etc/prometheus/
sudo chown -R prometheus:prometheus /etc/prometheus /var/lib/prometheus
6️⃣ Prometheus Configuration
/etc/prometheus/prometheus.yml
global:
  scrape_interval: 15s

scrape_configs:
  - job_name: "prometheus"
    static_configs:
      - targets: ["localhost:9090"]
7️⃣ Create Systemd Service
[Unit]
Description=Prometheus
After=network.target

[Service]
User=prometheus
ExecStart=/usr/local/bin/prometheus \
  --config.file=/etc/prometheus/prometheus.yml \
  --storage.tsdb.path=/var/lib/prometheus

[Install]
WantedBy=multi-user.target
Start Prometheus
8️⃣ Verify Prometheus
Open:
✔ UI loads → Prometheus running
9️⃣ Add Node Exporter (Server Metrics)
prometheus.yml
Reload:
🔍 10️⃣ PromQL Basics (VERY IMPORTANT)
| Query | Meaning |
|---|---|
| up | Target status |
| node_cpu_seconds_total | CPU |
| rate(metric[5m]) | Per-second rate |
| avg() | Average |
| sum() | Sum |
Example
📊 11️⃣ Grafana Integration
Step 1: Add Prometheus Data Source
Step 2: Import Dashboard
Best Dashboard
(Node Exporter Full)
🚨 12️⃣ Alerting (Prometheus + Alertmanager)
alert.rules.yml
groups:
- name: server-alerts
  rules:
  - alert: HighCPUUsage
    expr: avg(rate(node_cpu_seconds_total{mode!="idle"}[5m])) > 0.8
    for: 2m
    labels:
      severity: warning
    annotations:
      summary: "High CPU usage detected"
Add to prometheus.yml
13️⃣ Alertmanager Setup (Slack Example)
alertmanager.yml
route:
  receiver: "slack"

receivers:
- name: "slack"
  slack_configs:
  - api_url: "https://hooks.slack.com/services/XXX"
    channel: "#alerts"
14️⃣ Prometheus with Docker
docker run -d \
  -p 9090:9090 \
  -v $(pwd)/prometheus.yml:/etc/prometheus/prometheus.yml \
  prom/prometheus
15️⃣ Prometheus with Docker Compose
version: "3"
services:
  prometheus:
    image: prom/prometheus
    ports:
      - "9090:9090"
    volumes:
      - ./prometheus.yml:/etc/prometheus/prometheus.yml
16️⃣ Prometheus in Kubernetes (Overview)
-
Deployed via Helm
-
Uses ServiceMonitors
-
Node Exporter as DaemonSet
👉 Production standard: kube-prometheus-stack
17️⃣ Security Best Practices
✔ Do not expose Prometheus publicly
✔ Use firewall / VPN
✔ Protect Alertmanager
✔ Separate prod & staging
✔ Limit metric cardinality
18️⃣ Common Mistakes ❌
| Mistake | Fix |
|---|---|
| High disk usage | Reduce retention |
| Target DOWN | Firewall issue |
| Too many labels | Cardinality explosion |
| Using Prometheus for logs | Use Loki |
19️⃣ Prometheus vs Alternatives
| Tool | Best For |
|---|---|
| Prometheus | Metrics |
| Grafana | Visualization |
| Loki | Logs |
| Tempo | Traces |
| Datadog | All-in-one (paid) |
20️⃣ Production-Grade Setup
✅ Final Summary
✔ Industry-standard metrics system
✔ Cloud-native & scalable
✔ Powerful querying (PromQL)
✔ Works with Docker, K8s, VMs
✔ Perfect for DevOps monitoring